ARM CoreSight™️ by hand
contents
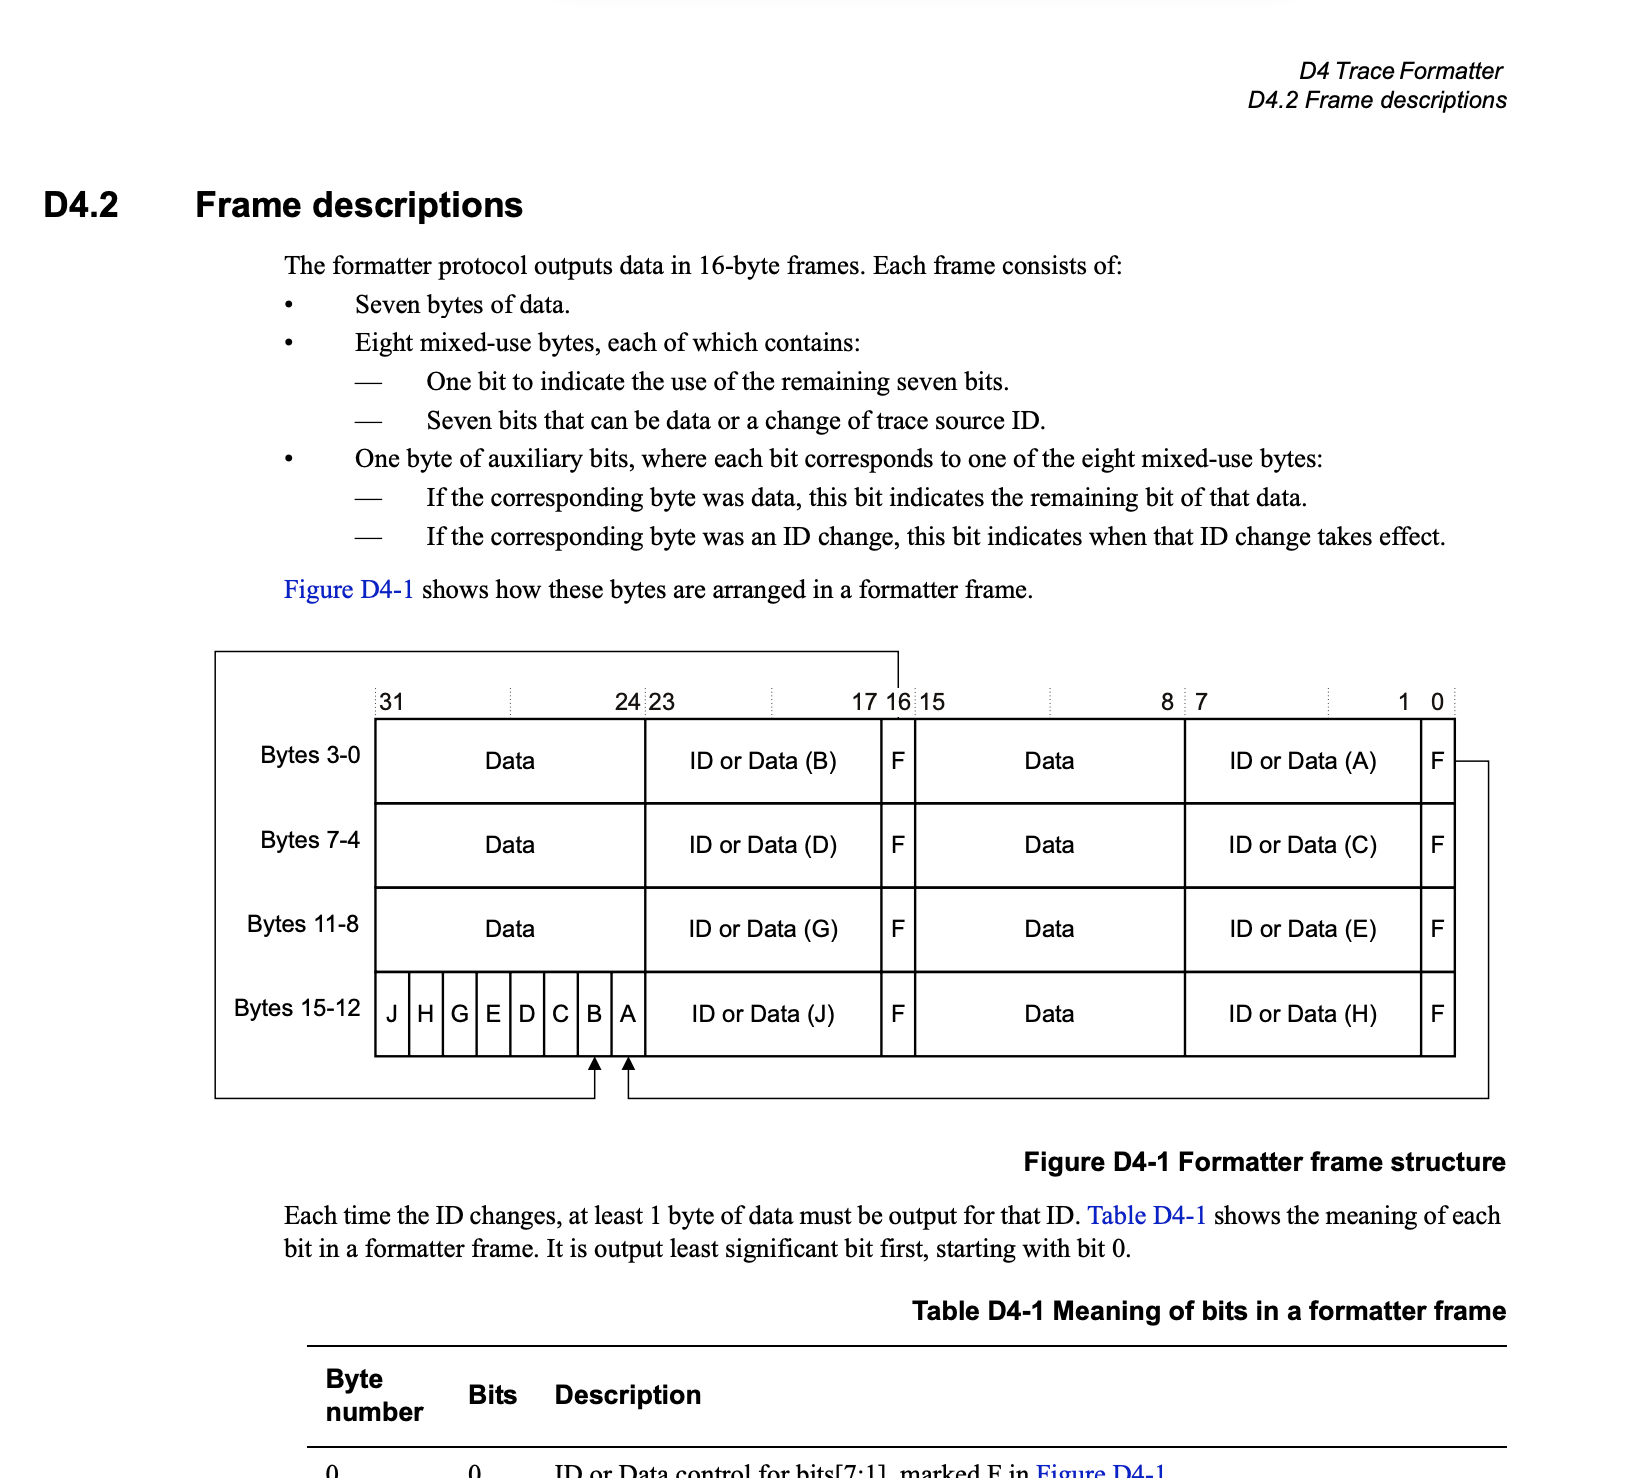
introduction
Many months ago, I had an issue where I had some firmware get stuck on a race condition in the DMA.
Inspecting the state through GDB+OpenOCD revealed that the DMA was stuck waiting for a transaction to complete on a disabled channel.
My go-to debugging methods revealed nothing. Stepping through the transaction begin and end logic reveals nothing.
RTT logging, despite being lauded for being as fast as a memcpy, was still slow enough to prevent this bug from triggering.
Fortunately, there's an even lower latency way to trace firmware behavior -- ARM CoreSight. Many modern Cortex-M microcontrollers come with the capability to stream CPU/memory behavior into a sideband without affecting the core whatsoever. Typically, your MCU's CoreSight implementation would be the workhorse powering some fancypants debugger (e.g SEGGER Ozone, TRACE32 PowerView, or ARM Keil µVision). However, these fancypants debuggers require a fancypants probe (such as a SEGGER J-TRACE or µLink PRO) to go with them.
Simple uses of CoreSight can be done manually through a garden-variety JTAG/SWD debugger, allievating the need for a fancypants debugger+probe.
project context
in my setup, I am using:
- An AT SAM E54 microcontroller (i.e a microcontroller with an ARM Cortex-M4 core)
- An ST-Link debugger
- My default inclination is to use a Microchip debugger wth the Microchip product (e.g like an ATMEL-ICE or MPLAB Snap). The ATMEL-ICE claims that it supports SWO, but I was unable to get OpenOCD to use it, so I switched to the ST-Link (where it definitely works).
- *not that I ultimately ended up using SWO in the end -- my bursts of trace data were too fast for 2 MHz SWO (the ST-Link driver in OpenOCD refused to run SWO any faster).
- OpenOCD + GDB
- bare metal firmware
- There is some prior art for ARM CoreSight inside a Linux environment (specifically, OpenCSD), but this is not directly applicable to my situation.
my problem
My application code enables two DMA channels to simultaneously drive the TX and RX halves of a SPI transaction. Something disables the TX DMA channel before the transaction is completed. The TX DMA is responsible for driving SCLK, so the RX DMA waits indefinitely for bytes to arrive on the bus. It's not immediately obvious how this happens -- by inspection, when the firmware starts the SPI transaction, the RX DMA channel is enabled before the TX DMA channel. From attempting other strategies (namely, RTT logging), I came to understand that this issue was timing-sensitive.
a brief note on coresight
CoreSight is a name for a group of related blocks that can be found in an ARM core.
- Instrumentation Trace Macrocell (ITM) - emits packets via the tracing sideband
- Data Watchpoint and Trace (DWT) - can trigger the ITM to emit packets on memory accesses or other events
- Embedded Trace Marcocell (ETM) - allows for instruction-level program tracing
-
Trace Port Interface Unit (TPIU) - controls how the above tracing elements emit packets. Packets can be emitted into
- SWO
- parallel trace
- the Embedded Trace Buffer (ETB), which is stored in RAM and must be read out after the fact
strategy
My hunch is that something is secretly disabling the DMA channel after its enabled but before the transaction completes.
I want to validate my hunch by using the DWT to trace every access to the DMAC control registers.
Although these packets can be streamed live via parallel trace or SWO, I chose to store them in the ETB.
Once extracted, the ITM packets emitted by the DWT can be decoded (e.g by itm-decode).
Enabling the CM4_TRACE clock domain + ETB Trace RAM
By default, the trace infrastructure inside the SAM E54 MCU is powered off -- the appropriate GCLK peripheral channel must be enabled. Additionally, the ETB is disabled by default. If enabled, it consumes the first 32KiB of SRAM (i.e memory addresses0x20000000 - 0x20008000 become inaccessible).
firmware side alterations:
- enable clock domain for CM4 trace infrastructure
- Strictly speaking, this can be done through a debugger; however, I like having it in my firmware to be maximally nice to tooling that is not aware of the particulars of the SAM E5X MCU.
- adjust linker script to provide space for ETB + set ETBRAMEN
- For the SAM E54, it is required to re-link your firmware.
     // Instantiate peripherals
     let mut p = atsamd_hal::pac::Peripherals::take().unwrap();
     let (mut buses, clocks, tokens) =
         clock::v2::clock_system_at_reset(p.oscctrl, p.osc32kctrl, p.gclk, p.mclk, &mut p.nvmctrl);


     // ......
     // elided: configuring the rest of the clock tree
     // ......

     let (_, _, gclk, mut mclk) = unsafe { clocks.pac.steal() };

+     // Enable clock for CM-Trace.
+     // See Table 14-9 in the AT SAM D5X/E5X Family Reference Manual.
+     gclk.pchctrl(47)
+         .write(|w| w.chen().set_bit().r#gen().gclk0());
+
+     // Enable ETB
+     unsafe {
+         // Clear write protection on the DSU
+         p.pac.wrctrl().write(|w| w.key().clr().perid().bits(33));
+         p.dsu.cfg().modify(|_, w| w.etbramen().set_bit());
+         p.pac.wrctrl().write(|w| w.key().set_().perid().bits(33));
+     }
 MEMORY
 {
     FLASH (rx) : ORIGIN = 0x00000000, LENGTH = 0x100000
-    RAM (rwx) : ORIGIN = 0x20000000, LENGTH = 0x18000
+    ETB (rwx) : ORIGIN = 0x20000000, LENGTH = 0x8000
+    RAM (rwx) : ORIGIN = 0x20008000, LENGTH = 0x10000
 }
Configuring CoreSight
While you can configure ETB/ITM/DWT/ETM registers from within your firmware, it is much more flexible to configure them through GDB/OpenOCD.The most obvious reason to enable CoreSight components directly inside firmware is to use DWT CYCCNT to measure the speed of tight loops
did my mcu vendor freestyle the addresses?
The ARM-v7M Architecture Reference manual provides the default address ranges of the CoreSight peripherals: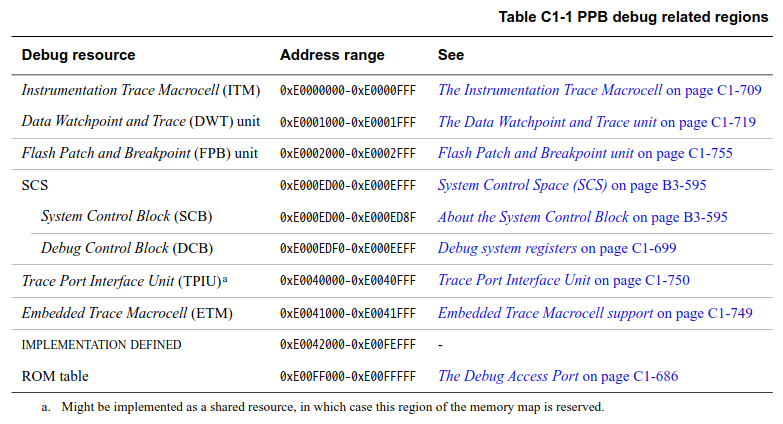
The full ROM table of the ATSAME54N19A
(gdb) monitor dap info
AP # 0x0
                AP ID register 0x24770011
                Type is MEM-AP AHB3
MEM-AP BASE 0x41003003
                Valid ROM table present
                Component base address 0x41003000
                Peripheral ID 0x000009fcd0
                Designer is 0x01f, Atmel
                Part is 0xcd0, Atmel CPU with DSU (CPU)
                Component class is 0x1, ROM table
                MEMTYPE system memory present on bus
        ROMTABLE[0x0] = 0x9f0fc003
                Component base address 0xe00ff000
                Peripheral ID 0x04000bb4c4
                Designer is 0x23b, ARM Ltd
                Part is 0x4c4, Cortex-M4 ROM (ROM Table)
                Component class is 0x1, ROM table
                MEMTYPE system memory present on bus
        [L01] ROMTABLE[0x0] = 0xfff0f003
                Component base address 0xe000e000
                Peripheral ID 0x04000bb00c
                Designer is 0x23b, ARM Ltd
                Part is 0x00c, Cortex-M4 SCS (System Control Space)
                Component class is 0xe, Generic IP component
        [L01] ROMTABLE[0x4] = 0xfff02003
                Component base address 0xe0001000
                Peripheral ID 0x04003bb002
                Designer is 0x23b, ARM Ltd
                Part is 0x002, Cortex-M3 DWT (Data Watchpoint and Trace)
                Component class is 0xe, Generic IP component
        [L01] ROMTABLE[0x8] = 0xfff03003
                Component base address 0xe0002000
                Peripheral ID 0x04002bb003
                Designer is 0x23b, ARM Ltd
                Part is 0x003, Cortex-M3 FPB (Flash Patch and Breakpoint)
                Component class is 0xe, Generic IP component
        [L01] ROMTABLE[0xc] = 0xfff01003
                Component base address 0xe0000000
                Peripheral ID 0x04003bb001
                Designer is 0x23b, ARM Ltd
                Part is 0x001, Cortex-M3 ITM (Instrumentation Trace Module)
                Component class is 0xe, Generic IP component
        [L01] ROMTABLE[0x10] = 0xfff41003
                Component base address 0xe0040000
                Peripheral ID 0x04000bb9a1
                Designer is 0x23b, ARM Ltd
                Part is 0x9a1, Cortex-M4 TPIU (Trace Port Interface Unit)
                Component class is 0x9, CoreSight component
                Type is 0x11, Trace Sink, Port
        [L01] ROMTABLE[0x14] = 0xfff42003
                Component base address 0xe0041000
                Peripheral ID 0x04000bb925
                Designer is 0x23b, ARM Ltd
                Part is 0x925, Cortex-M4 ETM (Embedded Trace)
                Component class is 0x9, CoreSight component
                Type is 0x13, Trace Source, Processor
        [L01] ROMTABLE[0x18] = 0xfff43003
                Component base address 0xe0042000
                Peripheral ID 0x04003bb907
                Designer is 0x23b, ARM Ltd
                Part is 0x907, CoreSight ETB (Trace Buffer)
                Component class is 0x9, CoreSight component
                Type is 0x21, Trace Sink, Buffer
        [L01] ROMTABLE[0x1c] = 0x00000000
        [L01]   End of ROM table
        ROMTABLE[0x4] = 0x00000000
                End of ROM table
(gdb)
Instrumentation Trace Macrocell (ITM)
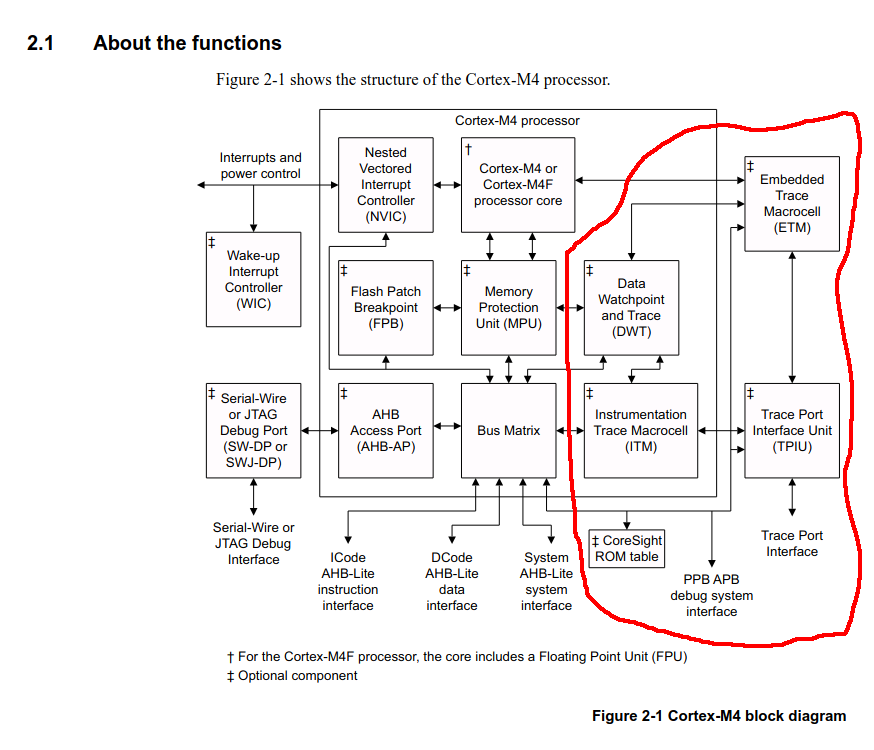
We need to enable the ITM since our DWT trace packets will flow through it (as per Figure 2-1 from the Cortex®-M4 Processor Technical Reference Manual) on their way out of the microcontroller.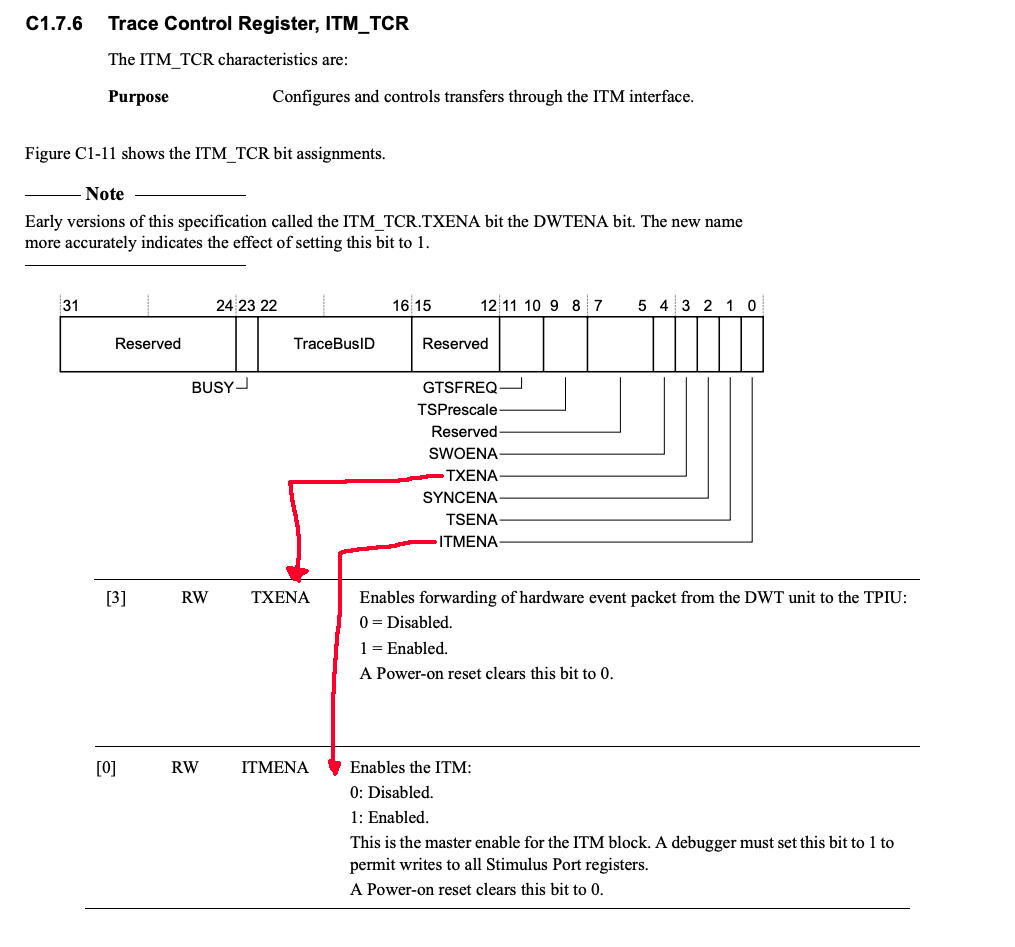
Data Watchpoint and Trace (DWT)
We want to configure the DWT to emit both the data value and the program counter every time a register in a DMA channel we care about is modified. For my particular instance, I'm using DMA channels 4 and 5. The control registers for these channels are in the address range0x4100_A080..0x4100_A0A0
The DWT is relatively straightforward to configure (at least in comparison to the ETM).
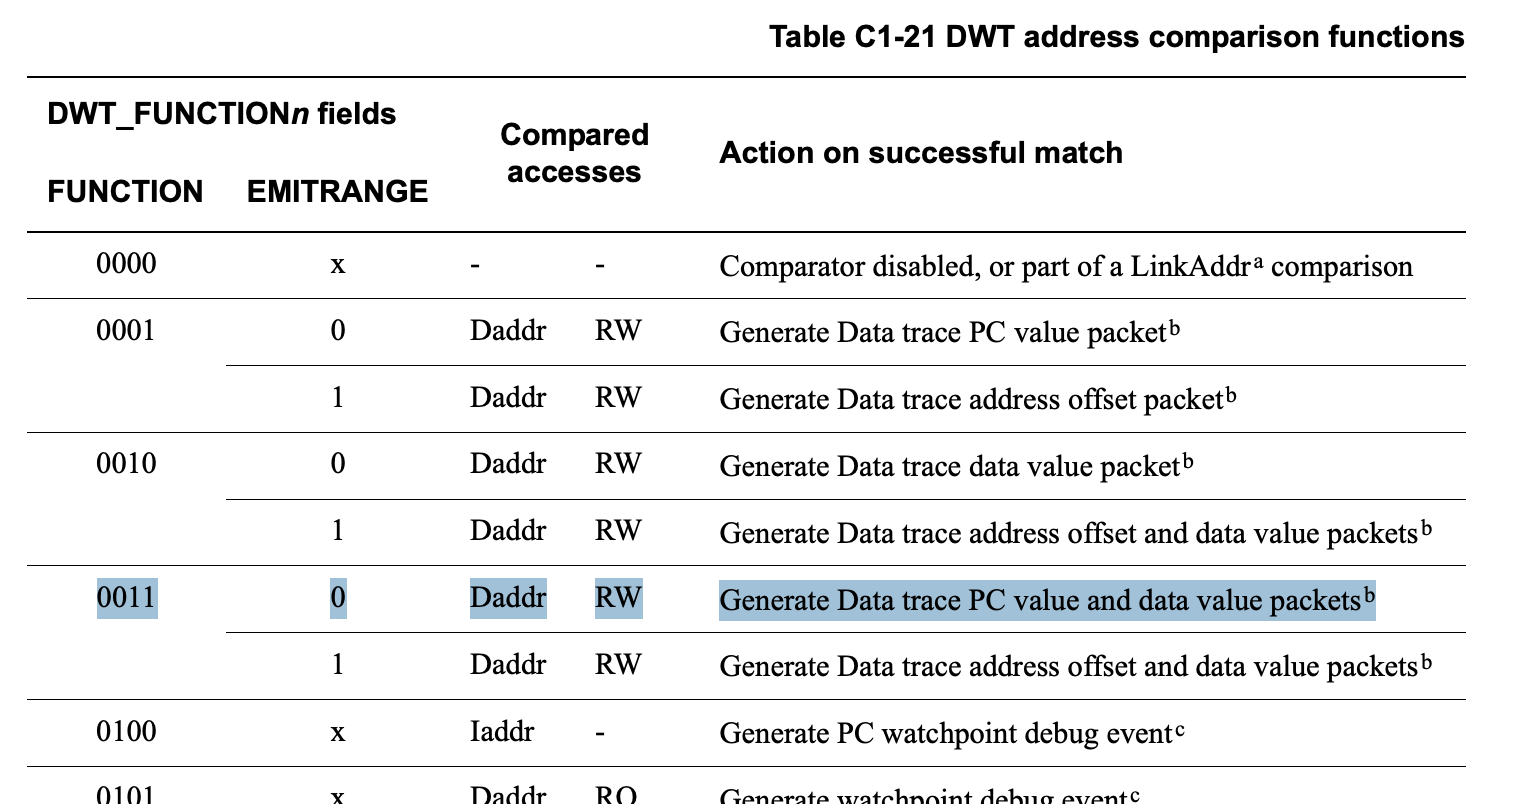
FUNCTION register.
In our case, we want to emit both data and program counter values on comparator match.
This will help us identify if the access is coming from our DMAC interrupt handler or our application code.
define dwtSetupDmacTrace
  # If debugging Rust/other-non-C code, GDB will expect us to use that
  # language's syntax to manipulate memory from within the debugger.
  push_lang c

  printf "Setting up DWT trace for DMAC channels 4-5 (0x4100A080-0x4100A0A0)\n"

  # Configure comparator 0 for DMAC range
  set *($DWT_COMP0) = 0x4100A080
  # Mask out lower 5 bits of comparator (i.e 32-byte range)
  set *($DWT_MASK0) = 5
  # FUNCTION = 0001 (PC trace + data value trace on RW), EMITRANGE = 0, DATAVMATCH = 0
  set *($DWT_FUNCTION0) = 0b011 | (0 << 5)

  pop_lang
end
Embedded Trace Buffer (ETB)
We care about enabling, disabling, and dumping the contents of the ETB. If we ignore the trigger (i.e always record every trace packet), the ETB behaves like a ring buffer of trace events. The ETB has an option to enable a formatter. This is important if you are using multiple trace sources with the ETB (e.g both ITM and ETM packets), as the formatter allows demuxing multiple streams. Otherwise, for one stream (as in our case), it merely complicates decoding.Specifically, I was having issues with handling formatted data with
itm-decode because formatting wraps the ITM protocol!
ETB_CTL- enable the ETBETB_RRD- read the next word from trace RAMETB_RRP/ETB_RWP- move the read and write pointers around trace RAM (relative to the start)
ETB_RWP by 1 in the process.
In order to read out values, one must disable the ETB and read from ETB_RRD, which increments ETB_RRP by 1.
In order to reset the position of the read and write pointers, we can manually write 0 to
ETB_RRP and ETB_RWP.
# ETB register base addresses for ATSAME54N19A
set $ETBBASE = 0xE0042000
set $ETB_RDP = $ETBBASE + 0x004
set $ETB_RRD = $ETBBASE + 0x010
set $ETB_RRP = $ETBBASE + 0x014
set $ETB_RWP = $ETBBASE + 0x018
set $ETB_TRG = $ETBBASE + 0x01C
set $ETB_CTL = $ETBBASE + 0x020
set $ETB_RWD = $ETBBASE + 0x024
set $ETB_FFSR = $ETBBASE + 0x300
set $ETB_FFCR = $ETBBASE + 0x304
set $ETB_LAR = $ETBBASE + 0xFB0
set $ETB_LSR = $ETBBASE + 0xFB4

# ##############################################
# ETB individual control functions
# ##############################################


define etbEnable
  push_lang c

  printf "Enabling ETB trace capture...\n"

  # Unlock ETB
  set *($ETB_LAR) = 0xC5ACCE55

  # Reset pointers
  set *($ETB_RWP) = 0
  set *($ETB_RRP) = 0

  # We're not using triggers, so set to 0 (trace before)
  set *($ETB_TRG) = 0x0

  # Disable formatting
  set *($ETB_FFCR) = 0b00

  # Enable tracing
  set *($ETB_CTL) = 1
  printf "ETB enabled\n"

  pop_lang
end

define etbDisable
  push_lang c

  printf "Disabling ETB trace capture...\n"
  etbUnlock
  set *($ETB_CTL) = 0
  printf "ETB disabled\n"

  pop_lang
end
Embedded Trace Macrocell (ETM)
For our particular bug, instruction level trace is not necessary to solve it. However, we have already done all of the prerequisite work required (e.g enabling the CM4_TRACE clock, configuring output method), and nothing else stops us from enabling the ETM. In fact, if we did enable the ETM and collect ETMv3 packets, we would be able to useorbmortem from the orbuculum suite to decode them
identifying the bug
We're going to- run firmware
- dump ETB using the GDB snippets we created above
- parse packets
collecting trace packets
All we need to do next is(gdb) etbEnable
(gdb) dwtSetupAll
(gdb) ITMTXEna 1
(gdb) ITMEna 1
(gdb) c
^C
(gbb) etbDump itm_packets.bin(gdb) c
Continuing.
Program received signal SIGTRAP, Trace/breakpoint trap.
lib::__bkpt () at asm/lib.rs:51
warning: 51 asm/lib.rs: No such file or directory
(gdb) bt
#0 lib::__bkpt () at asm/lib.rs:51
#1 0x0000130e in cortex_m::asm::bkpt ()
at /home/ritikmishra/.cargo/registry/src/index.crates.io-1949cf8c6b5b557f/cortex-m-0.7.7/src/call_asm.rs:19
#2 firmware:____embassy_main_task::{async_fn#0} () at firmware/src/main.rs:397
#3 embassy_executor::raw::TaskStorage::poll (p=...)
at /home/ritikmishra/.cargo/git/checkouts/embassy-c08a80187403f815/61b7762/embassy-executor/src/raw/mod.rs:220
#4 0x00013838 in embassy_executor::raw::{impl#9}::poll::{closure#0} (p=...) at src/raw/mod.rs:445
#5 embassy_executor::raw::run_queue::RunQueue::dequeue_all (self=, on_task=...) at src/raw/run_queue_atomics.rs:85
#6 embassy_executor::raw::SyncExecutor::poll (self=) at src/raw/mod.rs:438
#7 embassy_executor::raw::Executor::poll (self=) at src/raw/mod.rs:548
#8 0x000027c6 in embassy_executor::arch::thread::Executor::run
(self=0x2001ffe8, init=...)
at /home/ritikmishra/.cargo/git/checkouts/embassy-c08a80187403f815/61b7762/embassy-executor/src/arch/cortex_m.rs:105
#9 0x00002d8e in firmware:__cortex_m_rt_main () at firmware/src/main.rs:72
warning: (Internal error: pc 0x83b in read in CU, but not in symtab.)
#10 0x00002d78 in firmware:__cortex_m_rt_main_trampoline () at firmware/src/main.rs:72
warning: (Internal error: pc 0x83b in read in CU, but not in symtab.)
warning: (Internal error: pc 0x83c in read in CU, but not in symtab.)
warning: (Internal error: pc 0x83c in read in CU, but not in symtab.)
warning: (Internal error: pc 0x800 in read in CU, but not in symtab.)
warning: (Internal error: pc 0x83b in read in CU, but not in symtab.)
warning: (Internal error: pc 0x83b in read in CU, but not in symtab.)
(gdb) etbEnable
Warning: the current language does not match this frame.
Enabling ETB trace capture...
Unlocking ETB...
ETB Lock Status: 0x00000000
Resetting ETB read/write pointers...
Unlocking ETB...
ETB Lock Status: 0x00000000
ETB pointers reset
ETB enabled
(gdb) etbStatus
ETB Status: 0x00000000
ETB Control: 0x00000001
ETB Formatter/Flush Status: 0x00000000
ETB Formatter/Flush Control: 0x00000000
ETB Read Pointer: 0x00000000
ETB Write Pointer: 0x00000000
(gdb) dwtSetupAll
Setting up DWT trace for DMAC and SERCOM2...
Setting up DWT trace for DMAC channels 4-5 (0x4100A080-0x4100A0A0)
DWT Comp 0: address=0x4100a080, mask=5, function=0x00000003
Setting up DWT trace for SERCOM2 flags (0x4101201A)
DWT Comp 1: address=0x4101201a, mask=0, function=0x00000203
DWT trace setup complete. Use 'dwtStatus' to verify configuration.
(gdb) ITMTXEna 1
(gdb) ITMEna 1
(gdb) c
Continuing.
^C
Program received signal SIGINT, Interrupt.
0x000027c8 in embassy_executor::arch::thread::Executor::run (
self=0x2001ffe8, init=...)
at /home/ritikmishra/.cargo/git/checkouts/embassy-c08a80187403f815/61b7762/embassy-executor/src/arch/cortex_m.rs:106
106 asm!("wfe");
^C
Program received signal SIGINT, Interrupt.
0x000027c8 in embassy_executor::arch::thread::Executor::run (
self=0x2001ffe8, init=...)
at /home/ritikmishra/.cargo/git/checkouts/embassy-c08a80187403f815/61b7762/embassy-executor/src/arch/cortex_m.rs:106
106 asm!("wfe");
(gdb) etbDump itm_packets.bin
Disabling ETB trace capture...
Unlocking ETB...
ETB Lock Status: 0x00000000
ETB disabled
ETB write pointer: 4893 bytes (word index 4893)
Dumping 32768 bytes (full buffer) starting from index 4894
Wrote 32768 bytes to itm_packets.bin
(gdb) Loading...identifying the problem from the trace
Once we have the packets, it merely becomes an exercise in decoding them$ itm-decode dwt_trace.bin > dwt_trace.txt
DataTracePC { comparator: 0, pc: 51484 }
DataTraceValue { comparator: 0, access_type: Read, value: [2, 8, 32, 0] }
DataTracePC { comparator: 0, pc: 51498 }
DataTraceValue { comparator: 0, access_type: Write, value: [2, 8, 32, 0] }

Overflow
DataTracePC { comparator: 0, pc: 51532 }
Overflow
DataTraceValue { comparator: 0, access_type: Write, value: [0] }
DataTracePC { comparator: 0, pc: 51556 }
Overflow
DataTracePC { comparator: 0, pc: 51564 }
Overflow
DataTraceValue { comparator: 0, access_type: Write, value: [0] }
Overflow
DataTracePC { comparator: 0, pc: 52786 }
Overflow
DataTraceValue { comparator: 0, access_type: Write, value: [0] }
Overflow
DataTracePC { comparator: 0, pc: 52818 }
Overflow
DataTraceValue { comparator: 0, access_type: Write, value: [0] }


DataTracePC { comparator: 0, pc: 78638 }
DataTraceValue { comparator: 0, access_type: Read, value: [2] }
DataTracePC { comparator: 0, pc: 78660 }
DataTraceValue { comparator: 0, access_type: Read, value: [3] }
DataTracePC { comparator: 0, pc: 78668 }
Overflow
DataTracePC { comparator: 0, pc: 78676 }
Overflow


DataTraceValue { comparator: 0, access_type: Write, value: [0, 0, 32, 0] }
DataTracePC { comparator: 0, pc: 51484 }
DataTraceValue { comparator: 0, access_type: Read, value: [0, 0, 32, 0] }
DataTracePC { comparator: 0, pc: 51498 }


DataTraceValue { comparator: 0, access_type: Write, value: [2, 0, 32, 0] }
$pc = 51000, and the other is around $pc = 78000.
The addr2line tool makes it straightforward to determine that the former is from the application code (atsamd_hal::sercom::dma::async_dma::read_dma_linked)
and the latter is from the interrupt handler (atsamd_hal::dmac::async_api::InterruptHandler::on_interrupt).
The Rust code gets significantly affected by inlining, so we toss in some extra addr2line flags to clear that up.
ritikmishra@ritik-laptop:~/__workspace/mishra.farm$ arm-none-eabi-addr2line -Cie firmware.elf -f $(printf '0x%x' 51484)
core::ptr::read_volatile
/nix/store/kq9ssklndi7jzqfc5wqshanwjawhml7n-rust-1.86.0/lib/rustlib/src/rust/library/core/src/ptr/mod.rs:1752
vcell::VolatileCell::get
/home/ritikmishra/.cargo/registry/src/index.crates.io-1949cf8c6b5b557f/vcell-0.1.3/src/lib.rs:33
atsame54n::generic::Reg::modify
/home/ritikmishra/.cargo/git/checkouts/atsamd-72f4d01458ccd226/9e810c5/pac/atsame54n/src/generic.rs:594
atsamd_hal::dmac::channel::reg::ChctrlaProxy>::modify::{{closure}}
/home/ritikmishra/.cargo/git/checkouts/atsamd-72f4d01458ccd226/9e810c5/hal/src/dmac/channel/reg.rs:194
atsamd_hal::dmac::channel::reg::Register::with_chid
/home/ritikmishra/.cargo/git/checkouts/atsamd-72f4d01458ccd226/9e810c5/hal/src/dmac/channel/reg.rs:104
atsamd_hal::dmac::channel::reg::ChctrlaProxy>::modify
/home/ritikmishra/.cargo/git/checkouts/atsamd-72f4d01458ccd226/9e810c5/hal/src/dmac/channel/reg.rs:194
atsamd_hal::dmac::channel::Channel::enable
/home/ritikmishra/.cargo/git/checkouts/atsamd-72f4d01458ccd226/9e810c5/hal/src/dmac/channel/mod.rs:278
 as core::future::future::Future>::poll
/home/ritikmishra/.cargo/git/checkouts/atsamd-72f4d01458ccd226/9e810c5/hal/src/dmac/channel/mod.rs:785
atsamd_hal::dmac::channel::Channel::transfer_future_linked::{{closure}}
/home/ritikmishra/.cargo/git/checkouts/atsamd-72f4d01458ccd226/9e810c5/hal/src/dmac/channel/mod.rs:726
atsamd_hal::sercom::dma::async_dma::read_dma_linked::{{closure}}
/home/ritikmishra/.cargo/git/checkouts/atsamd-72f4d01458ccd226/9e810c5/hal/src/sercom/dma.rs:434

ritikmishra@ritik-laptop:~/__workspace/mishra.farm$ arm-none-eabi-addr2line -Cie firmware.elf -f $(printf '0x%x' 78666)
>::on_interrupt
/home/ritikmishra/.cargo/git/checkouts/atsamd-72f4d01458ccd226/9e810c5/hal/src/dmac/async_api.rs:?
The last one -- the one where the condition causing the hang occurs -- looks like this
DataTracePC { comparator: 0, pc: 51498 }
DataTraceValue { comparator: 0, access_type: Write, value: [2, 8, 32, 0] }
Overflow

## spurious wakes....


DataTracePC { comparator: 0, pc: 78676 }
Overflow
DataTraceValue { comparator: 0, access_type: Write, value: [0, 0, 32, 0] }
DataTracePC { comparator: 0, pc: 51484 }
DataTraceValue { comparator: 0, access_type: Read, value: [0, 0, 32, 0] }
DataTracePC { comparator: 0, pc: 51498 }


DataTraceValue { comparator: 0, access_type: Write, value: [2, 0, 32, 0] }
Overflow
DataTracePC { comparator: 0, pc: 51618 }
DataTracePC { comparator: 0, pc: 51640 }
Overflow
DataTraceValue { comparator: 0, access_type: Read, value: [0] }
Overflow
DataTracePC { comparator: 0, pc: 52872 }
DataTracePC { comparator: 0, pc: 52894 }
Overflow
DataTraceValue { comparator: 0, access_type: Read, value: [0] }
DataTracePC { comparator: 1, pc: 55942 }
DataTraceValue { comparator: 1, access_type: Read, value: [0, 0] }
DataTracePC { comparator: 0, pc: 53268 }
DataTraceValue { comparator: 0, access_type: Write, value: [7] }
DataTracePC { comparator: 0, pc: 53276 }


DataTraceValue { comparator: 0, access_type: Read, value: [0, 9, 32, 0] }
Overflow
DataTracePC { comparator: 0, pc: 53304 }
Overflow
DataTracePC { comparator: 0, pc: 53358 }
Overflow
DataTraceValue { comparator: 0, access_type: Write, value: [0] }
Overflow
DataTracePC { comparator: 0, pc: 53436 }
Overflow
DataTracePC { comparator: 0, pc: 53500 }
Overflow


DataTraceValue { comparator: 0, access_type: Read, value: [0] }
DataTracePC { comparator: 0, pc: 78638 }
DataTraceValue { comparator: 0, access_type: Read, value: [0] }
DataTracePC { comparator: 0, pc: 78648 }
DataTraceValue { comparator: 0, access_type: Read, value: [0] }
Instrumentation { port: 0, payload: [0] }
Sync
THE FIX
The DMAC ISR is not waipting for the DMA to finish disabling. The application attempts to reenable before the disable finishes. This results in the application waiting forever for an interrupt that will never fire. Changing the DMAC ISR to wait for the disable to finish fixes the problem (atsamd-rs/atsamd#938): w.enable().clear_bit();
w.trigsrc().variant(TriggerSource::Disable)
});
+ while dmac.channel(channel).chctrla().read().enable().bit_is_set() {
+ core::hint::spin_loop();
+ }
+
+ // Prevent the compiler from re-ordering read/write operations beyond this fence.
+ // (see https://docs.rust-embedded.org/embedonomicon/dma.html#compiler-misoptimizations)
+ atomic::fence(atomic::Ordering::Acquire);
WAKERS[channel].wake();also read:
-
Official ARM documentation
-
Armv7-M Architecture Reference Manual
- Contains ITM and DWT register definitions
- Appendix D4 contains the ITM/DWT packet protocol, which is implemented by
itm-decode
- Cortex-M4 Technical Reference Manual
- Arm CoreSight Architecture Specification v3.0
-
CoreSight Components Technical Reference Manual
- Contains ETB register definitions
-
Embedded Trace Macrocell Architecture Specification
- Contains ETM register definitions
-
CoreSight ETM-M4 Technical Reference Manual
- Provides clarity on top of the ETM architecture specification with respect to what functionality is available on Cortex-M4 devices
-
Armv7-M Architecture Reference Manual
-
Tools to assist in your journey
- orbuculum is useful to livestream ITM channels over SWO + to posthumously parse ETM packets (although, when I last tried, there were some bugs in their reimplementation of
addr2linefor mapping decoded instructions to source) itm-decodeis useful for debugging ITM/DWT packets dumped from the ETB.
- orbuculum is useful to livestream ITM channels over SWO + to posthumously parse ETM packets (although, when I last tried, there were some bugs in their reimplementation of
- Coresight on Linux
- SAM D5x/E5x family Datasheet